Automate Fire Summary Statistics
During the wildfire season, our daily workflow often got quite hectic. Our customers wanted instant stats on affected areas and the possible effects on their policies as a wildfire progresses. Our internal executives and cat response teams also want the same information. Additionally, our marketing team wants to get articles, blog posts, and twitter posts out as soon as possible. We needed a way to quickly process and reprocess the information as a wildfire progresses. This code eliminated manual data collection and processing - with the click of a button, the code:
- fetches updated wildfire perimeter data collected by the NIFC
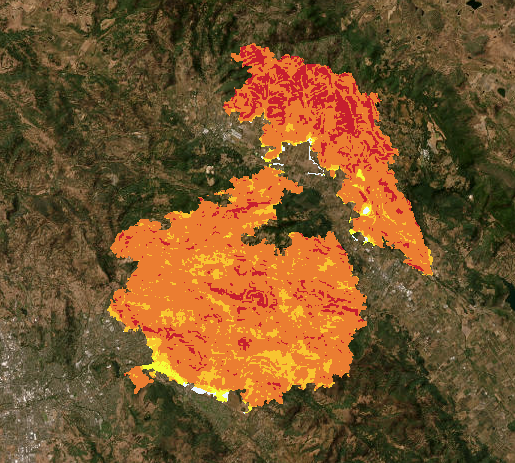
- extracts our risk data within the perimeter
- generates summaries and a visualization for our internal team using folium
- outputs a quick one-liner for the marketing team
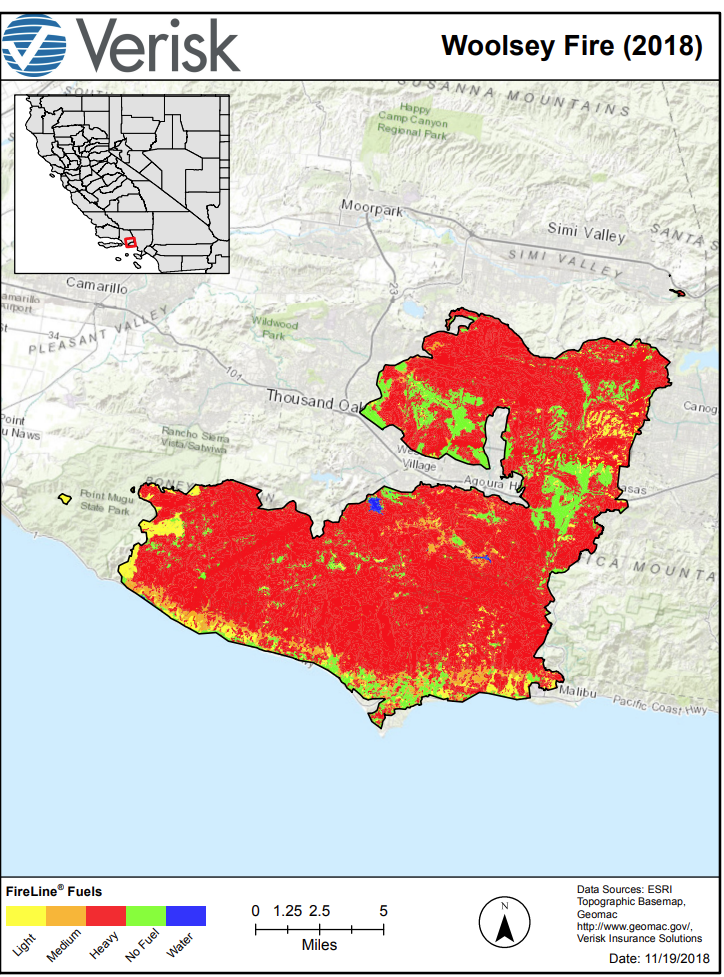
- Runs the ArcPy code to process standard map product we send to customers via the commandline